
Statistics
How many DNS queries a network answered and how many it blocked, as totals and a trend from today back to twelve months, and what the figures do and do not cover.
Statistics is the first page of the Cloud DNS section. It shows how the service is actually used on a network: how many DNS queries it answered, how many of them it blocked, and how that has developed over time. It is the page to open when someone asks whether the filtering does anything, or how much.
Read the page
Section titled “Read the page”Pick a period at the top: Today, 7 days, 30 days, 6 months or 12 months. Three figures follow, for that period:
- Queries answered is every lookup the resolver answered, blocked or not.
- Blocked is how many of them a policy stopped.
- Share blocked is the second as a share of the first, with one decimal. It shows a dash rather than a zero until something has been measured, because “nothing measured” and “nothing blocked” are different statements.
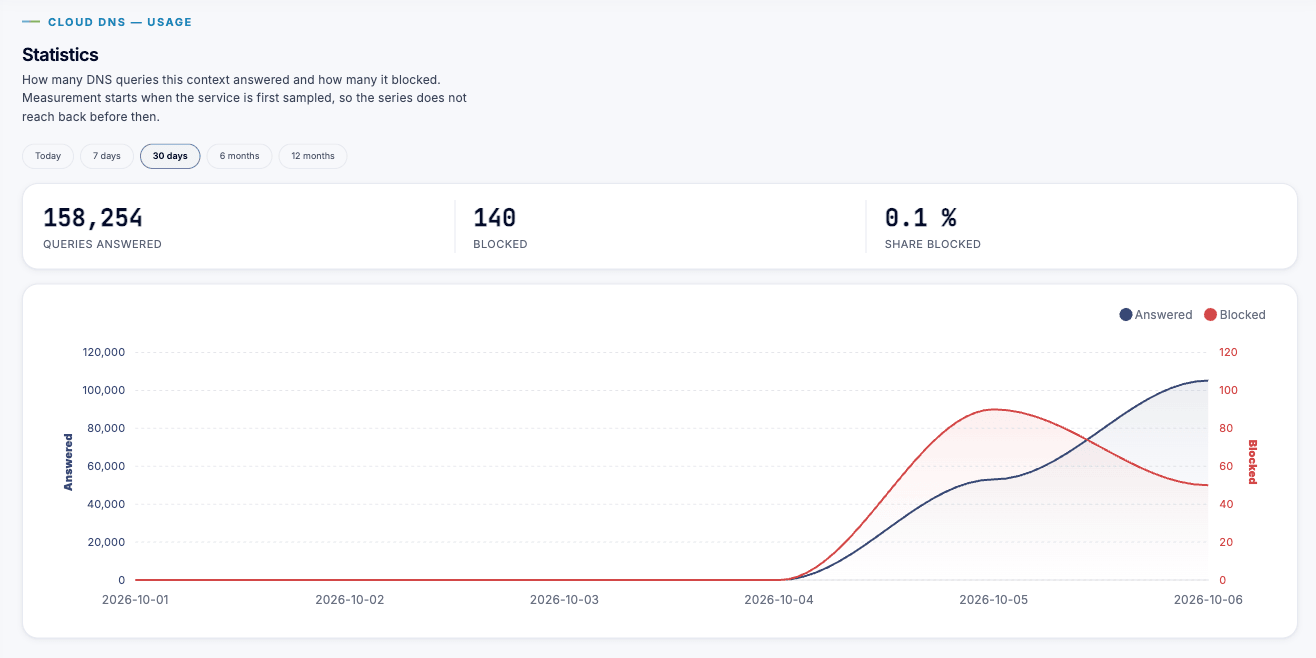
Below them, a chart draws both series over the period. Blocked lookups are normally a small fraction of all lookups, so the chart gives each series its own axis; a shared scale would flatten the blocked line against the baseline, which is exactly the line the page exists to show. Today is drawn per hour, 7 and 30 days per day, and 6 and 12 months per month.
What the figures cover
Section titled “What the figures cover”- They are counted per network, the context you are in. There is no breakdown per client, per site or per domain, and no list of individual lookups: Cloud DNS keeps no per-query log. To find out how the policies treat a particular name, use Look up a domain on the Policies page; to see what a particular client gets, make the lookup from that client.
- Usage is sampled every few minutes from the resolver, and the series starts when the service was first sampled. A network that was just switched to Cloud DNS, or whose resolver has not answered a query yet, reads Nothing measured yet.
- If the resolver could not be reached for a while, that span is left blank rather than counted as zero; the next sample covers it. A chart gap therefore means “not measured”, not “nothing happened”.
Who sees it
Section titled “Who sees it”The page follows the roles that read the context’s other statistics, such as the context owner. It does not require the connector manager role that Policies, Lists and DNS settings need, so someone who follows the network without configuring it can still see how the filtering is used.