
Integration Log
Failed outbound calls to your Cisco ISE, per Context: what was called, on whose behalf, and what went wrong. Where to find it, how to filter it, and how to read an entry.
When something Endpoint Manager for Cisco ISE sends to your Cisco ISE doesn’t work, the Integration Log is where the reason is. It records the outbound calls that failed, with enough detail to fix the cause rather than open a ticket about it.
This is usually the first place to look, before the symptom-driven diagnostics page.
Where it is
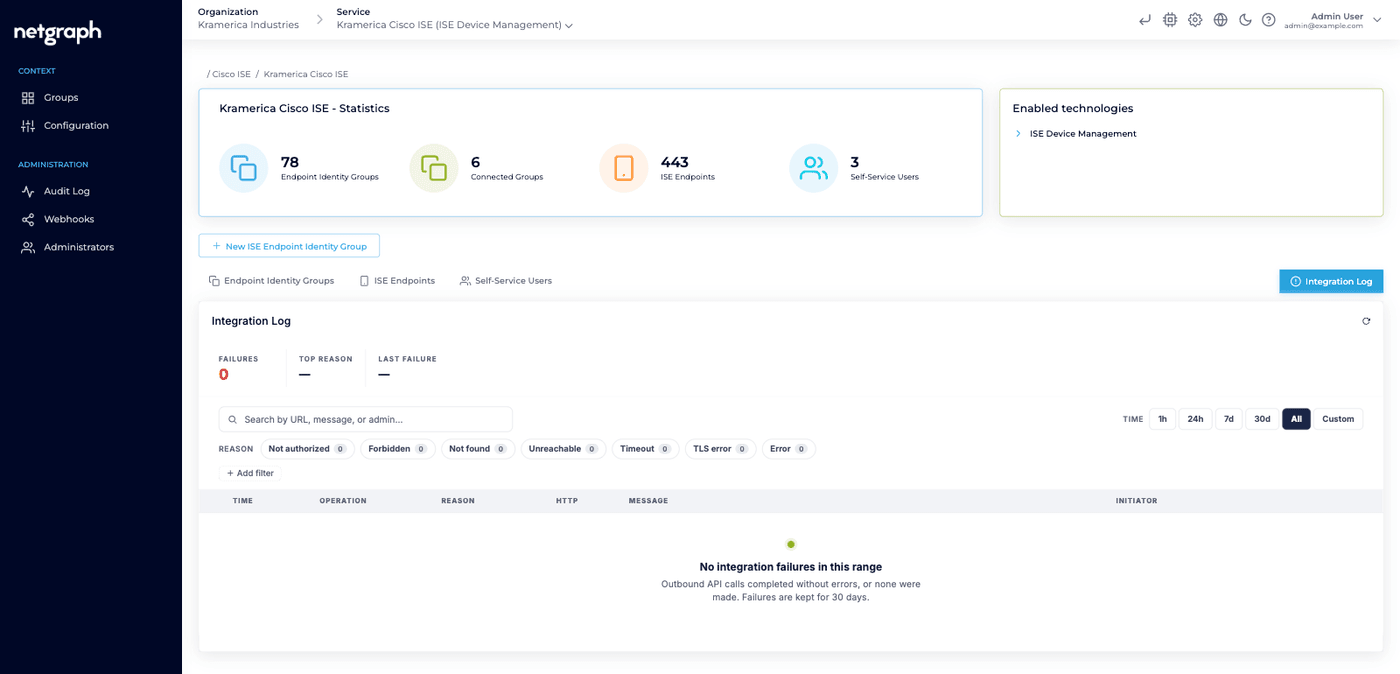
Section titled “Where it is”Two ways in, both showing the same log, scoped to one Cisco ISE Context:
- The Integration Log tab on the Context overview.
- The link on the Cisco ISE API Status card, reading View Integration Log — recent failed API calls.
The two answer different questions. The status card tells you whether the API works right now. The log tells you what failed recently and why.
It is an admin surface. Self-Service Users never see it.
What gets recorded
Section titled “What gets recorded”Failures only. A call that succeeds leaves no entry, and neither do ordinary conditions that merely look like failures — a device that is offline has no session to read, and that is not an error.
Connectivity checks are recorded, deliberately. Adjusting a firewall rule and watching each attempt arrive is a legitimate way to use this log.
Operations
Section titled “Operations”List endpoint groups · Get endpoint group · Create endpoint group · List endpoints · Get endpoint · Add endpoint · Update endpoint · Delete endpoint · Session lookup · CoA reauth · Bulk update · API status check · TLS check
Triggers
Section titled “Triggers”| Trigger | Means |
|---|---|
| Admin action | Someone in the admin console did something that reached Cisco ISE |
| Sync job | A background task, such as the periodic attribute verification |
| System | Follow-on work the platform did itself, such as the CoA after a key change |
Reasons
Section titled “Reasons”| Reason | Usually means |
|---|---|
| Not authorized | Cisco ISE rejected the API credentials |
| Forbidden | The credentials were accepted, but the account may not use that API |
| Not found | The path didn’t exist on the Cisco ISE node |
| Unreachable | The connection was refused or dropped before ISE answered |
| Timeout | Cisco ISE didn’t respond in time |
| TLS error | The certificate couldn’t be validated, or the handshake failed |
| Error | Anything else |
Unreachable and TLS error are kept apart on purpose. A connection dropped before the handshake finishes is reported as Unreachable, so you aren’t sent to inspect a certificate that was never presented.
Filtering
Section titled “Filtering”A summary strip gives the number of failures in range, the most common reason, and when the last one happened. Below it:
- Search across URL, message and administrator.
- Time range — 1h, 24h, 7d, 30d, All, or a custom window.
- Reason chips, each carrying its own count.
- + Add filter for a specific operation or HTTP status.
- Clear all.
Empty is a good result, and the page says so: “Outbound API calls completed without errors, or none were made.”
Reading an entry
Section titled “Reading an entry”Expanding a row gives you the whole call.
The message is the part to read first. It’s written to be acted on, not escalated:
| Situation | What to check |
|---|---|
| Credentials rejected | The API username and password, and that ERS and Open API access are enabled for that account in Cisco ISE |
| Permission denied | The account’s ISE role. The Monitoring API needs MnT Admin or Super Admin |
| Path not found | That the Base URL is right and the API is enabled on that node |
| Name not resolvable | The hostname in the Base URL, and DNS |
| Timed out | Whether Cisco ISE is up, and whether something is silently dropping traffic to that address and port |
| Certificate rejected | Whether the certificate is trusted, in date, and issued for the hostname you’re calling |
Below it: the method and the URL, the request as it was sent, and the response as Cisco ISE returned it. When the call never got that far the entry says so outright, rather than showing an empty box.
A side panel repeats the reason, HTTP status, who triggered it, the trigger type and the full timestamp.
Reproducing the call
Section titled “Reproducing the call”An entry offers View curl: a ready-to-run command that reproduces exactly the request the platform sent, so you, your network team, or Cisco support can run it from somewhere else and see whether the result is the same.
It is view-and-copy. There’s no file to download. Credentials appear as placeholders for you to substitute, never the real ones, and the address in the command is your own configured Cisco ISE address.
A very large request, such as a bulk update covering hundreds of endpoints, is stored in shortened form and offers no command, because it would no longer reproduce the original call. The entry tells you that’s why.
Retention
Section titled “Retention”Entries are kept for 30 days, then removed automatically.
Getting failures out of the platform
Section titled “Getting failures out of the platform”Integration failures are available as a webhook event on a Cisco ISE Context, alongside the configuration audit event, so they can be pushed into monitoring or ticketing rather than watched by hand. See Webhooks.
How it differs from the Audit Log
Section titled “How it differs from the Audit Log”Both are per Context, and they answer different questions.
| Audit Log | Integration Log | |
|---|---|---|
| Records | What people and the platform did | Which outbound calls to Cisco ISE failed |
| Includes successes | Yes | No |
| Answers | Who changed this, and when | Why didn’t this reach Cisco ISE |
| Retention | Follows the subscription | 30 days |
One action can appear in both: the audit log shows that someone tried to add an endpoint, the integration log shows why Cisco ISE refused it.